
Publisher:
Bonnie King
CONTACT:
Newsroom@Salem-news.com
Advertising:
Adsales@Salem-news.com

~Truth~
~Justice~
~Peace~
TJP
Nov-24-2009 14:32

 TweetFollow @OregonNews
First American CoreLogic Releases Q3 Negative Equity Data
Salem-News.comThe amount of equity for each property was determined by subtracting the property's estimated current value from the mortgage debt outstanding.
 Images: First American CoreLogic |
(SALEM, Ore.) - First American CoreLogic, the first company to develop a national, state and city-level negative equity report, has released third quarter data that includes a proprietary model which factors in loan amortization and utilization rates for home equity lines of credit (HELOC), providing a more precise view of "underwater borrowers."
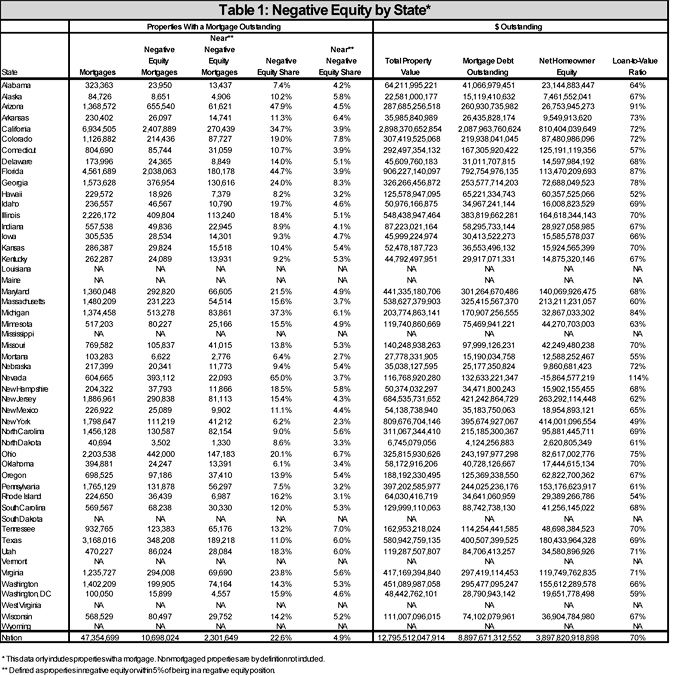
According to First American CoreLogic, nearly 10.7 million, or 23 percent, of all residential properties with mortgages were in negative equity as of September 2009. (As a point of comparison, using the previous methodology, which did not account for amortization or HELOC utilization, the Q3 negative equity rate would have been 33.8 percent.)
Negative equity, often referred to as "underwater" or "upside down," means that borrowers owe more on their mortgage than their homes are worth. Negative equity can occur because of a decline in value, an increase in mortgage debt or a combination of both.
In Salem, 12.96 percent, or 8,844, of all residential properties with a mortgage, were in negative equity as of September 2009 based on the enhanced methodology factoring in amortization and HELOC utilization. (As a point of comparison, using the previous methodology, the Q3 negative equity rate would have been 27.8 percent as compared to 24.55% percent reported for Q2.)
National Data Highlights
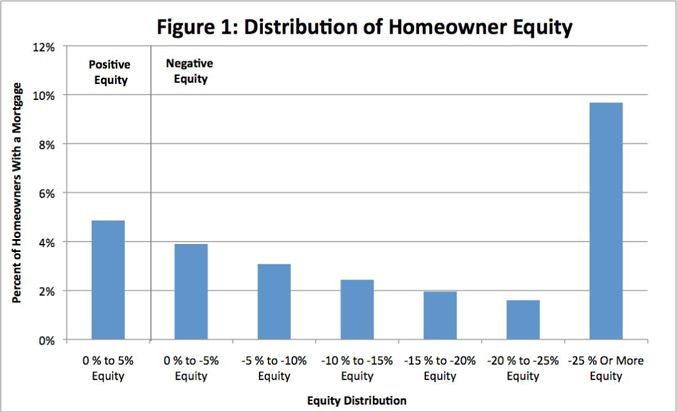
* Nearly 10.7 million, or 23 percent, of all residential properties with mortgages were in negative equity as of September, 2009. An additional 2.3 million mortgages were approaching negative equity, meaning they had less than five percent equity. Together negative equity and near negative equity mortgages account for nearly 28 percent of all residential properties with a mortgage nationwide.
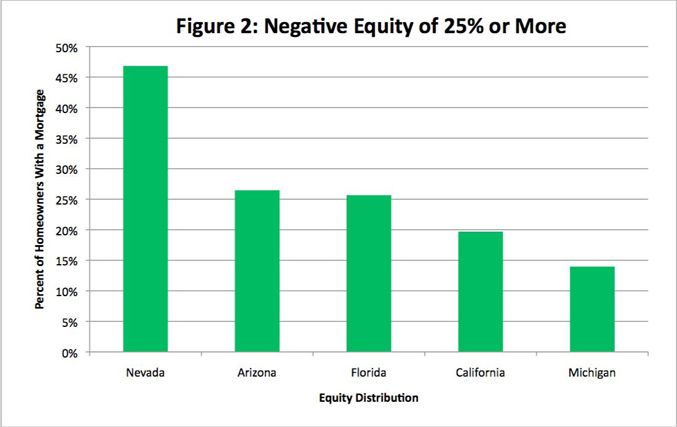
* The distribution of negative equity is heavily concentrated in five states: Nevada (65 percent), which had the highest percentage negative equity, followed by Arizona (48 percent), Florida (45 percent), Michigan (37 percent) and California (35 percent). Among the top five states, the average negative equity share was 40 percent, compared to 14 percent for the remaining states. In numerical terms, California (2.4 million) and Florida (2.0 million) had the largest number of negative equity mortgages accounting for 4.4 million or 42 percent of all negative equity loans
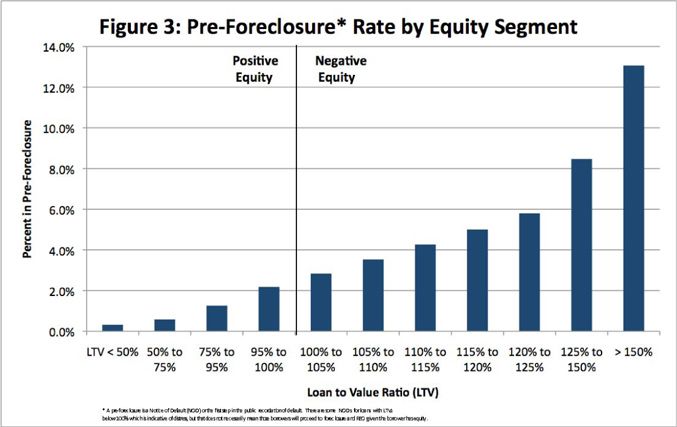
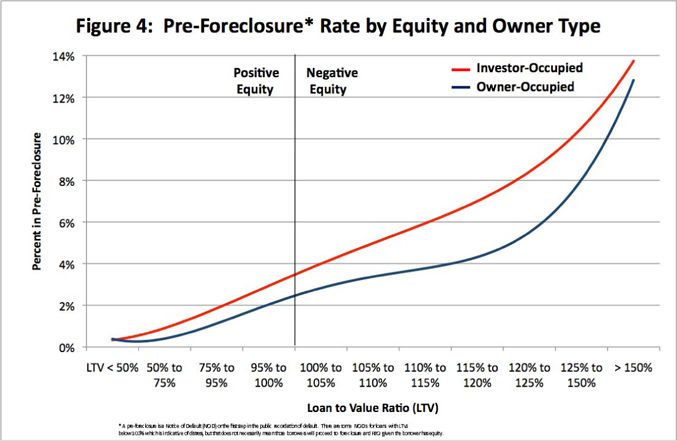
* The rise in negative equity is closely tied to increases in pre-foreclosure activity. At one end of the spectrum, borrowers with equity tend to have very low default rates. At the other end, investors tend to default on their mortgages once in negative equity more ruthlessly: their default rate is typically two to three percent higher than owner-occupied homes with similar degrees of negative equity. For the highest level of negative equity, investors and owners behave very similarly and default at similar rates (Figure 4). Strategic default on the part of the owner occupier becomes more likely at such high levels of negative equity.
* The bulk of 'upside down' borrowers, as a group, share certain characteristics. They:
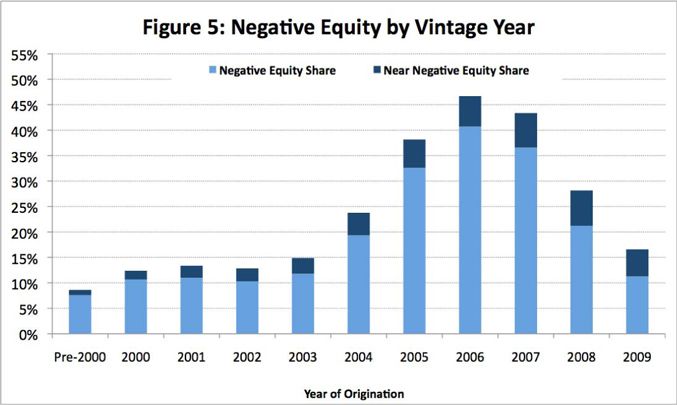
o Financed their properties between 2005 and 2008, with 2006 being the peak year where 40 percent of borrowers were in negative equity (Figure 5). Negative equity continues to be a problem even for 2009 originations as evidenced by a negative equity share of 11 percent and another 5 percent near negative equity.
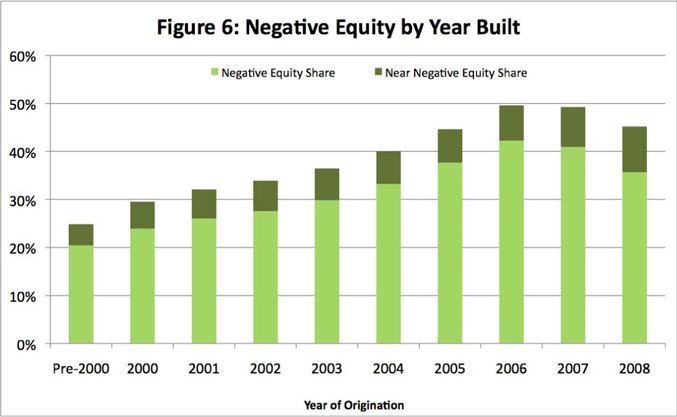
o Purchased newly built homes that are concentrated in a small number of states. For homes built between 2006 and 2008, the negative equity share is over 40 percent.
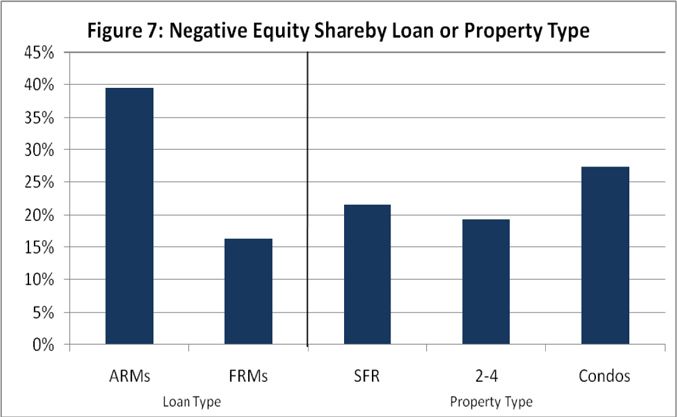
o Relied on adjustable rate mortgages (ARMs)
o Bought less expensive properties. The average value for all properties with a mortgage is $270,200, but properties in negative equity have an average value of $210,300 or 22 percent less (Figure 8). The average mortgage debt for properties in negative in equity was $280,000 and borrowers that were in a negative equity position were upside down by an average of nearly $70,000. The aggregate property value for loans in a negative equity position was $2.2 trillion, which represents the total property value at risk of default, against which there was a total of $2.9 trillion of mortgage debt outstanding.
"This enhanced methodology provides a more precise picture of this significant problem that so many homeowners are facing," said Mark Fleming, chief economist with First American CoreLogic. "Negative equity continues to be pervasive and to impact almost every segment of the housing market. The recent improvement in home prices this past spring and summer has slowed the increase in negative equity, but it will take a significant rebound in home prices, which we are not expecting, to offset the dampening effects of negative equity in the most depressed states."
Methodology*:
First American CoreLogic's data includes 47 million properties with a mortgage, which accounts for over 90 percent of all mortgages in the U.S.* The data was revised for Q3 2009 to adjust for amortization and HELOC utilization. The net impact of the revisions was an expected decline in negative equity. As a result, these estimates are not comparable to prior quarters.
First American CoreLogic used its public record data as the source of the mortgage debt outstanding (MDO) and it includes 1st mortgage liens and junior mortgage liens in order to capture the true level of mortgage debt outstanding for each property. The current value was estimated by using the First American CoreLogic Automated Valuation Models (AVM) for residential properties. The data was filtered to include only properties valued between $30,000 and $30 million because AVM accuracy tends to quickly worsen outside of this value range.
The amount of equity for each property was determined by subtracting the property's estimated current value from the mortgage debt outstanding. If the mortgage debt was greater than the estimated value, then the property is in a negative equity position. The data was created at the zip code level and aggregated to the state and U.S. totals.
* Only data for mortgaged residential properties that have an AVM value is presented. There are several states where the public record, AVM or mortgage coverage is very thin. Although coverage is thin, these states account for fewer than 5 percent of the total population of the U.S.
** The definition of pre-foreclosure is a Notice of Default, which is the first step in the public record filing process. It is very possible for borrowers with positive equity to be seriously delinquent and receive a pre-foreclosure notice, but if the amount of equity is enough, they typically will be forced to sell their home to avoid foreclosure.

Source: First American CoreLogic
Articles for November 23, 2009 | Articles for November 24, 2009 | Articles for November 25, 2009

Quick Links
DINING
Willamette UniversityGoudy Commons Cafe
Dine on the Queen
Willamette Queen Sternwheeler
MUST SEE SALEM
Oregon Capitol ToursCapitol History Gateway
Willamette River Ride
Willamette Queen Sternwheeler
Historic Home Tours:
Deepwood Museum
The Bush House
Gaiety Hollow Garden
AUCTIONS - APPRAISALS
Auction Masters & AppraisalsCONSTRUCTION SERVICES
Roofing and ContractingSheridan, Ore.
ONLINE SHOPPING
Special Occasion DressesAdvertise with Salem-News
Contact:AdSales@Salem-News.com


Terms of Service | Privacy Policy
All comments and messages are approved by people and self promotional links or unacceptable comments are denied.
[Return to Top]
©2025 Salem-News.com. All opinions expressed in this article are those of the author and do not necessarily reflect those of Salem-News.com.